Pie charts are an effective way to visualize data in PowerPoint. With a few simple steps, you can create animated pie charts that pop out when clicked, allowing you to build interactive slides for each segment. This guide will walk you through the process of making animated clickable pie charts that reveal more information.
How to Add Animation to Pie Charts
Pie charts are probably the most used charts to visualize data in Microsoft PowerPoint. To make this data look more satisfying to see, you can add some animations within the chart. Check out a guide below about how to animate pie charts in PowerPoint!
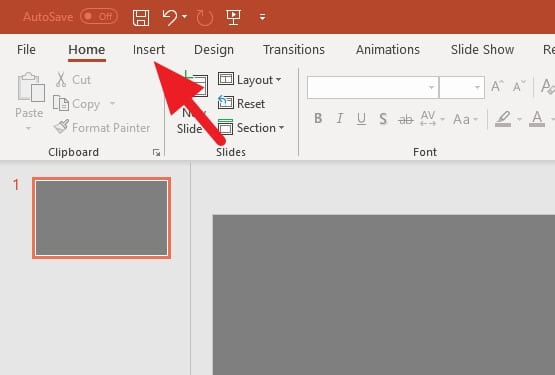
1. Go to the Insert menu.
2. Click on Chart.

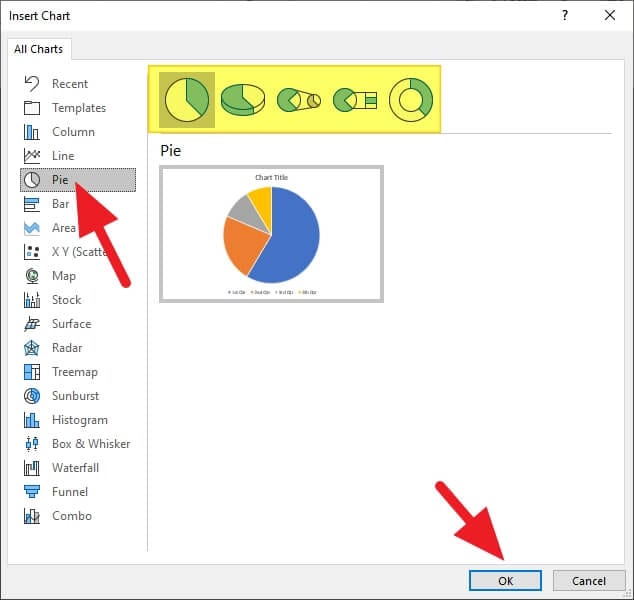
3. Go to the Pie chart menu, and select the type of chart you want to use. Then, click OK. In this guide, I’m going to use the basic pie chart.
4. You can adjust the value of the chart in this Excel-like window.

5. Go to Animations.

6. Select Wheel. You can choose other animations type you want, but the Wheel animation, in particular, looks really great on pie charts. You can see the result at the end of this guide.

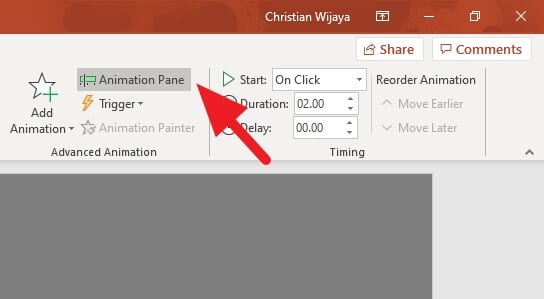
7. Still within the Animations menu, click on Animation Pane.
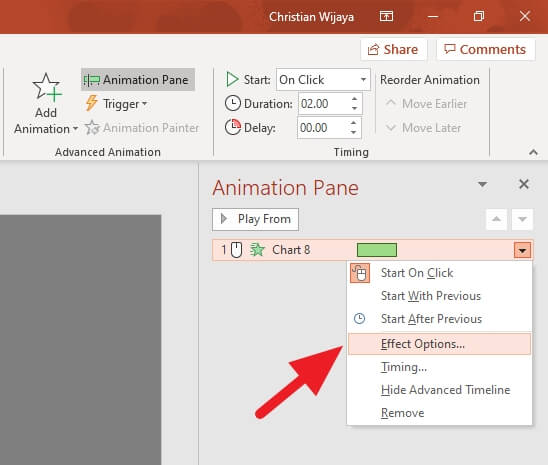
8. Right-click on the Chart at the Animation Pane, then select Effect Options…
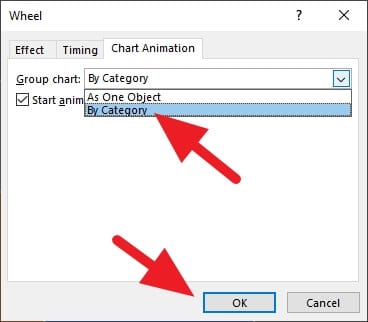
9. On the Chart Animation tab, select By Category and click OK to confirm the new setting.
10. Here’s the result. If the GIF below doesn’t animate, see via this link.

Keep in mind, you can also set the trigger of animations, its duration, timing, and other effects. If the animations won’t start during a presentation, please refer to 5 Fixes for Animation Won’t Start in PowerPoint.
FAQs
How do I create an animated chart in PowerPoint?
To create an animated chart in PowerPoint, first select the chart you want to animate. Then, navigate to the “Animations” tab and choose an animation. You can further customize the animation by selecting “Effect Options”.
How do you add unique animations in PowerPoint?
To add unique animations in PowerPoint, select the object or text you want to animate, then go to the “Animations” tab and choose an animation. You can add more effects by selecting “Add Animation” and choosing another effect. You can also change the order of animations by selecting an animation marker and choosing to move it earlier or later in the sequence.
How do you make a beautiful pie chart in PowerPoint?
To make a beautiful pie chart in PowerPoint, remember to only use it when comparing parts of a whole. You can enhance its appearance by using different colors for each segment, adding data labels, and using a 3D effect for a more visually appealing look.
How do you make an animated figure in PowerPoint?
To animate a figure in PowerPoint, select the figure you want to animate, then go to the “Animations” tab and choose an animation. You can adjust the timing, order, and type of animation using the “Effect Options”. For a more interactive presentation, you can make the animation respond to mouse clicks or other actions.


