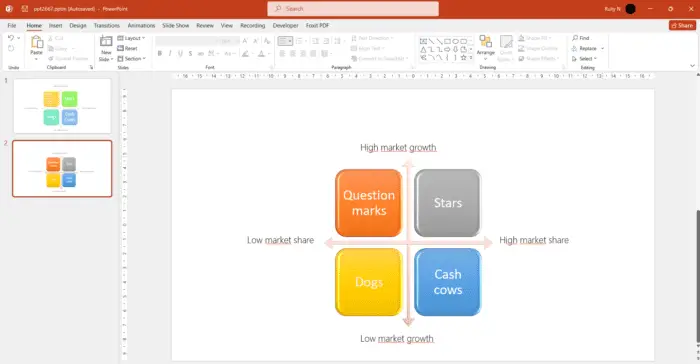
In this tutorial, we’re going to show you how to create a BCG matrix in PowerPoint using SmartArt. SmartArt allows you to create various types of diagrams and graphics with just a few clicks.
What is BCG matrix
The BCG matrix or growth-share matrix is a business tool that you can use to help you create strategic, long-term plans regarding investment in competitiveness and market attractiveness. It is a framework for portfolio management that allows you to prioritize different products based on their market share and market growth rate. The BCG matrix helps managers to allocate resources effectively and to identify potential opportunities and threats in their product portfolio.
Categories in BCG matrix
The BCG matrix divides products into four categories:
- Stars are products with high market share and high market growth rates, and they require continuous investment to maintain their position.
- Cash cows are products with high market share and low market growth rates, and they generate steady cash flow that can be used to invest in other products.
- Question marks are products with low market share and high market growth rates, and they require careful analysis to decide whether to invest in them or not.
- Dogs are products with low market share and low market growth rate, and they usually have low profitability and should be divested or repositioned.
Steps to create a BCG matrix
1. Open the slide where you want to insert the BCG matrix. Click on the Insert tab and then click on SmartArt.

2. Select Matrix from the left pane and then choose the Grid Matrix option from the right pane. Click OK.

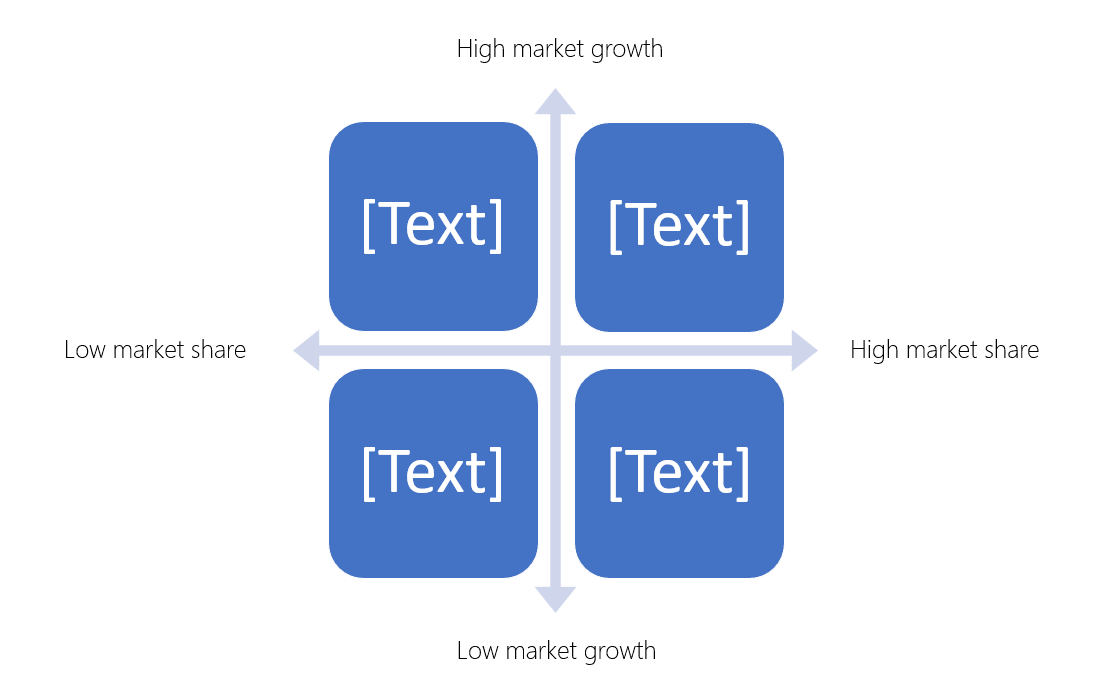
3. You will see a 2×2 matrix on your slide with four placeholders for text. You can resize and move the matrix as you like.

4. To add labels to the axes, go to Insert and select Text Box.

5. Draw four text boxes, and in the text box type High market growth, High market share, Low market share, and Low market growth. These will be the labels for the vertical and horizontal axes respectively.
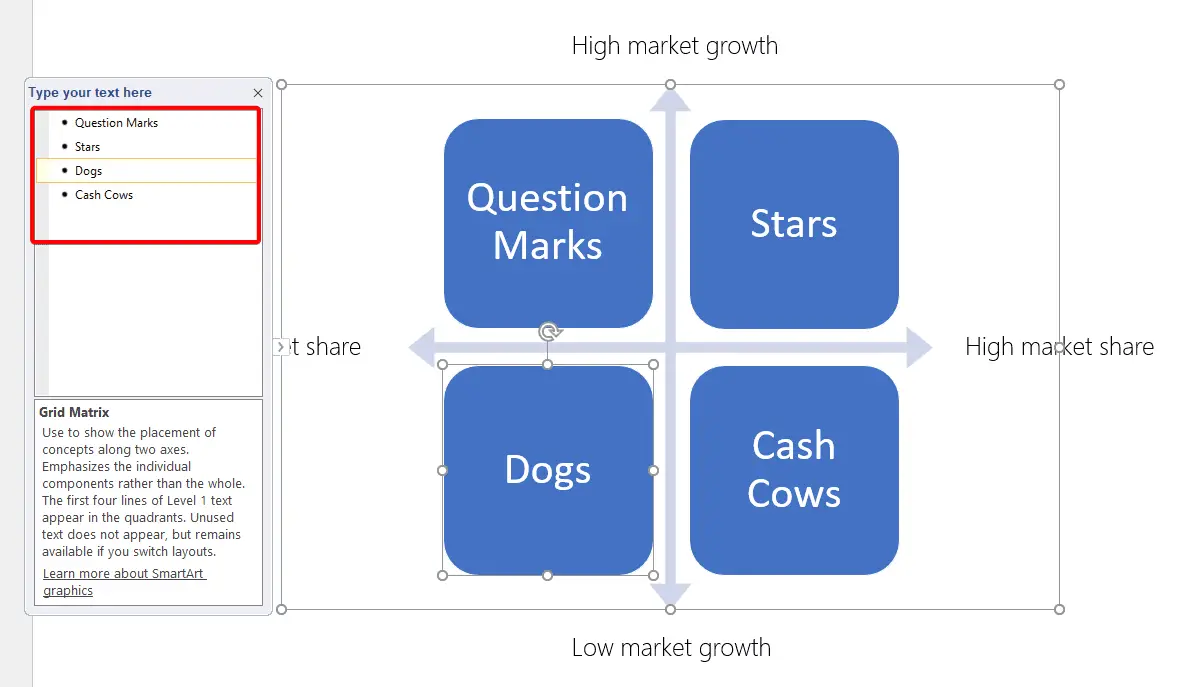
6. To add labels to the quadrants, click on each placeholder and type Stars, Cash Cows, Question Marks, and Dogs respectively. These will be the labels for the four quadrants of the matrix.
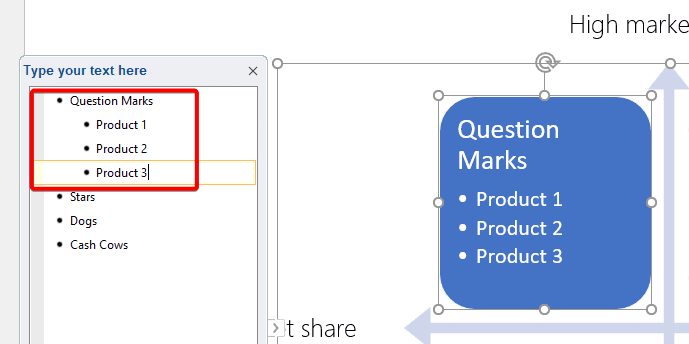
7. To add the list of what product belongs to which labels, click the placeholder, in the SmartArt Design tab, and click Add Bullet.

8. Then start to input the product name.
9. To format your BCG matrix, you can use the options in the SmartArt Design tabs to change the colors, styles, and layout of your matrix and its elements.
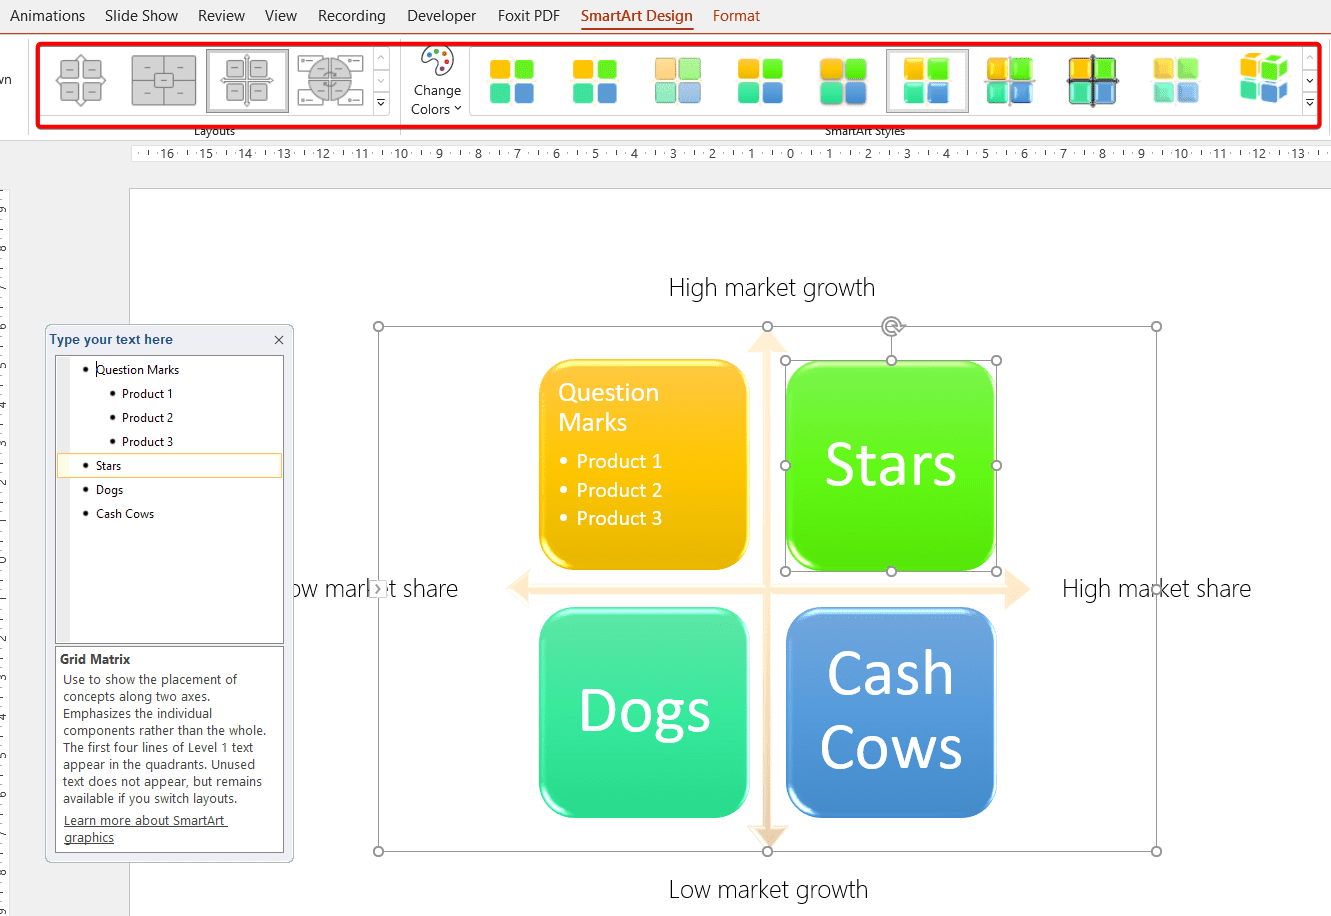
And that’s it! You have created a BCG matrix in PowerPoint using SmartArt in just a few minutes. You can use this technique to create other types of matrices as well, such as SWOT analysis, Ansoff matrix, etc.
