Are you a math teacher? If yes, how do you teach your students in school by another thing such as a book? Perhaps, you present the math material by using a presentation slide. So, how did you do in your presentation if you had to put any diagrams?
It must be confusing, right? It might be you create any diagrams by editing them one by one, but it takes too much time. No worries, here is a solution for you to make a diagram in your presentation slides.
Before we dive in, did you know what the diagrams are and what they’re for? Here is the explanation briefly!
What is a Venn diagram?
A Venn diagram is an infographic used primarily to represent any set theory. On the other hand, the Venn diagram is used to show information graphically by the combination of one or several elements delimited in a closed line.
For instance, circles or ovals are used, which converge in an area called ‘intersection’ that represents the elements that overlap between two or more elements within the same ‘universe’.
Therefore, the Venn diagram is used to visually explain the logic between various elements, which is helpful in a business presentation or any presentation related to the fields of mathematics, statistic, or computer science.
Components of Vend diagram
To comprehend Venn diagrams correctly, you must know the names of each component contained within the charts:
- Union is a collection of information or elements that you display in a Venn diagram, and it’s commonly shaped like a circle or oval.
- Set is the union of all the Venn diagram’s sets or circles.
- An intersection is a place where several sets overlap. It’s also known as a ‘subset’.
- The symmetric difference is the result of comparing many sets.
- A universal set is an area containing the sets that comprise the Venn diagram.
- Absolute complement refers to the extent not part of a set that includes the surface around the ovals.
- Relative complement is the individual component of a subset that doesn’t belong within the intersection.
So, you can create your own Venn diagram simply and quickly by just taking a few minutes in Google Slides. Here are the following steps!
Creating a Venn diagram in Google Slides
1. Ensure you’ve opened Google Slides’ blank document. To start to make your Venn diagram, go for ‘Insert‘ immediately to see more options. Then, choose ‘Diagram‘ in the menu option.

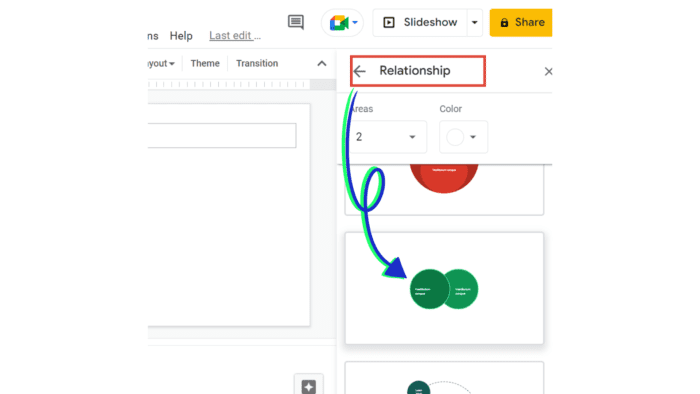
2. Next, the ‘Diagram’ menu toolbar will appear on your right side. Then, if you want to make a Venn diagram, you can choose the ‘Relationship‘ option to see more Venn diagram designs.

3. Once you click on the needed diagram, drag it into your blank document. There you have it! Venn diagrams are now available in your PowerPoint slides. Then you’re good to go!

An objective of using Venn diagrams is to illustrate how elements in a particular area relate. A Venn diagram is an incredible way to visualize data and information clearly and efficiently. This is what makes Venn diagrams so effective in presentations.


