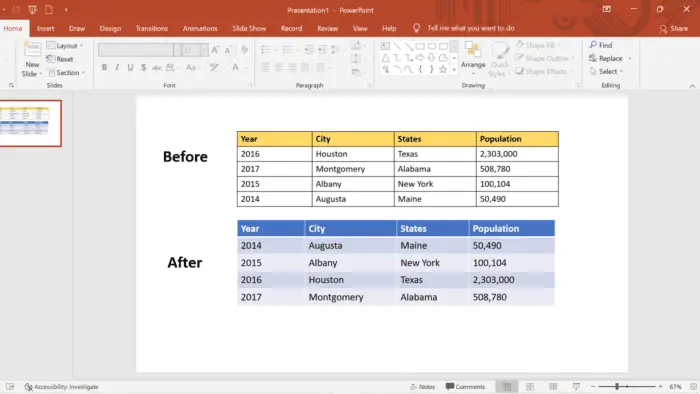
Have you ever made a data statistic in PowerPoint? Most of the data will be presented in numeric format. When you reorganized them, how did you do that? The table must be used, right?
Frequently, when you receive data in a table, the data must be served in a random format. To make your table data more visually appealing, scroll them up and down. Therefore, sorting the table data in a specific order is critical before going through it.
Sorting data is an integral part of data analysis if you want a table that contains your information arranged alphabetically in a list, inventory level from highest to lowest, or order rows by colors and icons.
But, you know why?
Unfortunately, PowerPoint doesn’t provide a “Sort” feature in its menu. Even though you have the option to add, customize, and insert new tables in PowerPoint, you cannot sort the data in these tables.
Thus, how do you sort a table in PowerPoint? No worries, you can still sort your data in PowerPoint. However, you will need a workaround on how you can sort the table data by re-editing it via Ms. Word or Ms. Excel.
Here are the multiple steps you can conduct to sort your table data in PowerPoint through Ms. Word. Without any further do, let’s follow the instructions!
How to sort a table in PowerPoint
1. Launch Ms. PowerPoint on your desktop and open the presentation you are currently working on. Here is a sample dataset with information about various series that need to be alphabetized. After that, copy this table into Ms. Word by selecting the table > right click > select copy. In addition, you can just type CTRL+C to copy the table.

2. Launch Ms. Word > open a “new document” > paste your table data here.

3. Switch over to the table layout tab to sort your table. Next, choose ‘Layout’ and click the ‘Sort Option.’ You can sort columns by selecting the column from the sort by drop-down menu in the sort window.
Here, we choose year because the number pulls the header row descriptor. Add a second level of sorting by selecting the city from the drop-down menu. After they’re all set up, click ‘ok‘.

4. The sorted data in the table has been completed correctly. Next, you can copy this to PowerPoint and paste it into your presentation.

6. There you go! The difference between your data before and after can now be seen.

What’s up with you guys? Does the instruction make sense to you? Are you able to follow it without any problems? Thank you for following the instructions. We hope you will be able to do so without any issues.
Overall, PowerPoint can automate the requirements of your presentations in the workplace, but there are a few weaknesses you might uncover. For example, when you need to sort a table on a slide.
As we know, PowerPoint does not have a sort option. However, this does not mean you can’t sort your data. Try to come up with any creative ways to accomplish it. It’s okay if you need to do it yourself by putting in a workaround. In the meantime, we wish you the best of luck with this information!


