Introduction
Tables are a great way to present data in an organized way in PowerPoint presentations. They allow you to arrange information in rows and columns, making complex data easier to comprehend.
In PowerPoint 2013, it’s easy to create, format, and customize tables to meet your needs. This article will cover everything you need to know about working with tables in PowerPoint 2013.
Inserting Tables
There are a few different ways to insert a table in PowerPoint 2013:
- On the Insert tab, click the Table button and select the number of rows and columns you want.
- Draw a table using the Draw Table option. This allows you to draw a custom table by dragging column and row dividers.
- Copy and paste a table from Excel or another Office program. The table formatting will be retained.
You can adjust the size of a table after inserting it by dragging the handles on the edges and corners. Right-clicking the table also gives you options to insert or delete rows and columns.
Formatting Tables
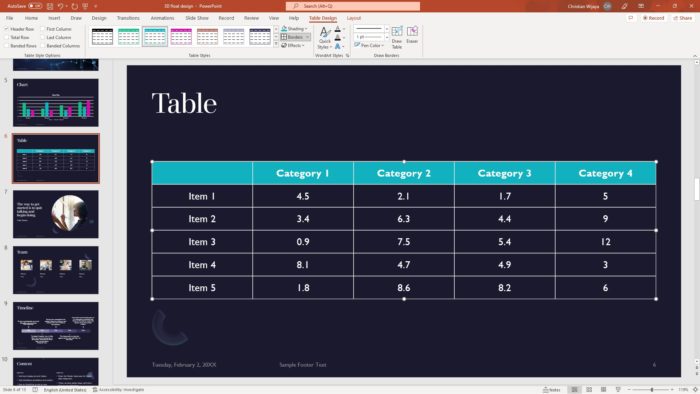
Once your table is inserted, the Table Tools tabs (Design and Layout) will appear on the ribbon. Here you’ll find everything you need to customize the look of your table:
Applying Table Styles
Table styles allow you to quickly apply professional formatting to your table. Just select your table and click one of the premade styles on the Design tab.
Table Borders and Shading
Customize the borders, gridlines, and background shading using the options on the Design tab. You can add or remove borders from specific sides of cells and apply color shading.
Text Alignment and Direction
Format the alignment and orientation of text in the table cells using the options on the Layout tab. Choose left, center, or right alignment. You can also rotate text vertically.
Modifying Tables
On the Layout tab you’ll find tools to modify the structure of an existing table:
- Insert and delete rows and columns
- Merge and split cells
- Distribute rows and columns evenly
- Align text to the top/middle/bottom of cells
Right-clicking inside a cell also provides table modification options.
Data Tables
Connecting your PowerPoint table to an Excel data source allows the table to update dynamically when the source spreadsheet changes. On the Design tab, click Export > Export Table to Excel.
This creates a linked Excel worksheet you can edit. The PowerPoint table will reflect any changes next time you open the presentation.
Accessible Tables
To ensure your PowerPoint tables are accessible to those using screen readers, include clearly defined row and column headers. On the Design tab, make sure the Header Row option is checked to identify the first row as a header.
Also avoid merged cells, nested tables, and blank rows or columns which can be confusing for screen readers.
Conclusion
Tables are an excellent way to present data visually in PowerPoint. By inserting them properly and taking advantage of the formatting and layout options, you can create clear, polished tables. Linking your PowerPoint table to a data source takes things a step further by integrating dynamic Excel data.
With the table creation and modification tools in PowerPoint 2013, building professional, informative tables is quick and easy.
Summary of Key Points
- Insert tables by specifying rows and columns, drawing a custom layout, or copy/pasting
- Use Table Styles on the Design tab to instantly apply formatting
- Modify borders, shading, alignment, text direction, and structure from the Table Tools tabs
- Link to an Excel worksheet to create a dynamic data table
- Set the first row as a header row for accessibility


