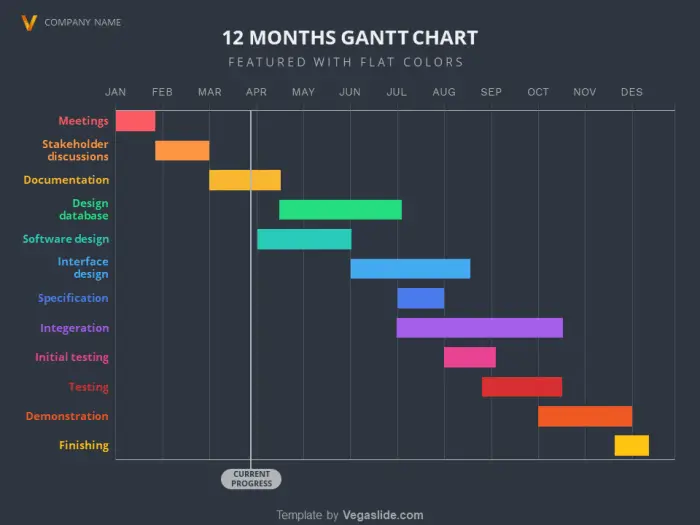
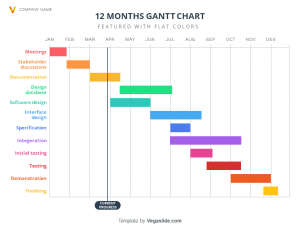
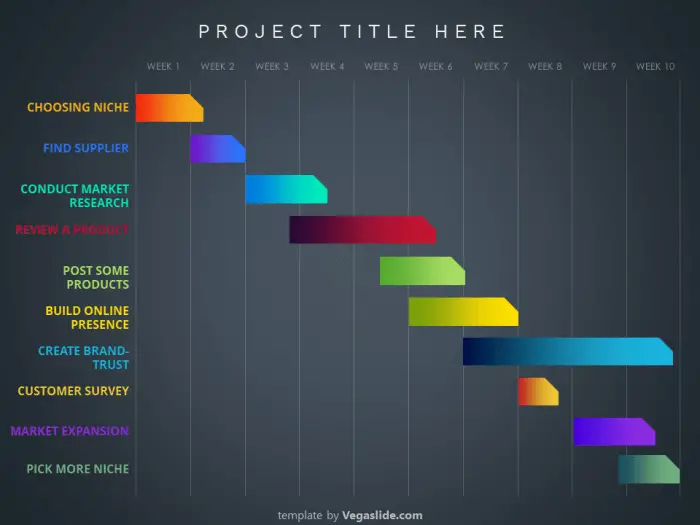
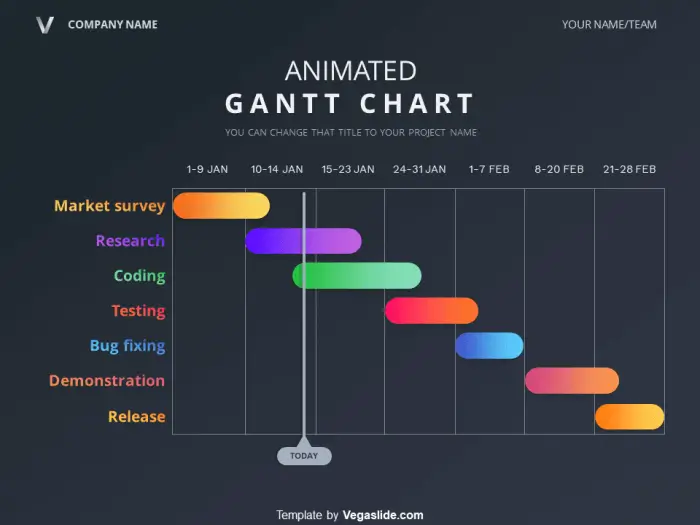
With a different color for each schedule, people could easily distinguish what task should be done and how long it would take. There are 12 months available along with its timeline bar. You can also adjust the progress bar at the bottom of the chart representing the current phase when you show the slide. This PowerPoint template is great for explaining a project timeline that requires 12 months or less of completion.
Features
- Dark and bright theme available
- Fully flat colors
- 12 items representing each month
- Progress bar ready
Muito bom, parabéns!!
Your work is amazing, dude!!
I LOVE the colors you choose, it makes me crazy!
Keep it going!
the download link leads to an infinite loop without the download starting, any chance it can be fixed?